tl;dr
- Analyses were performed by controlling for area, base zoning, and neighborhood.
- NCDs rarely issue even a single permit that has a net housing increase of at least 1 unit in an entire year.
- The Mid-Cambridge NCD is ~50% less likely to issue a single housing-positive permit than an equivalent Res C plot of land outside the NCD per year.
- The Half Crown-Marsh NCD stands in a world of its own, having issued no housing positive permits in the 29 year dataset.
- NCDs are hotspots for down-conversion projects, and with more housing losses than comparable plots of land outside the NCD.
- For projects that are net housing losses, NCDs are associated with a ~10 fold increase in the number of units lost, on average, compared to an equivalent Res C plot of land outside the NCD.
Background
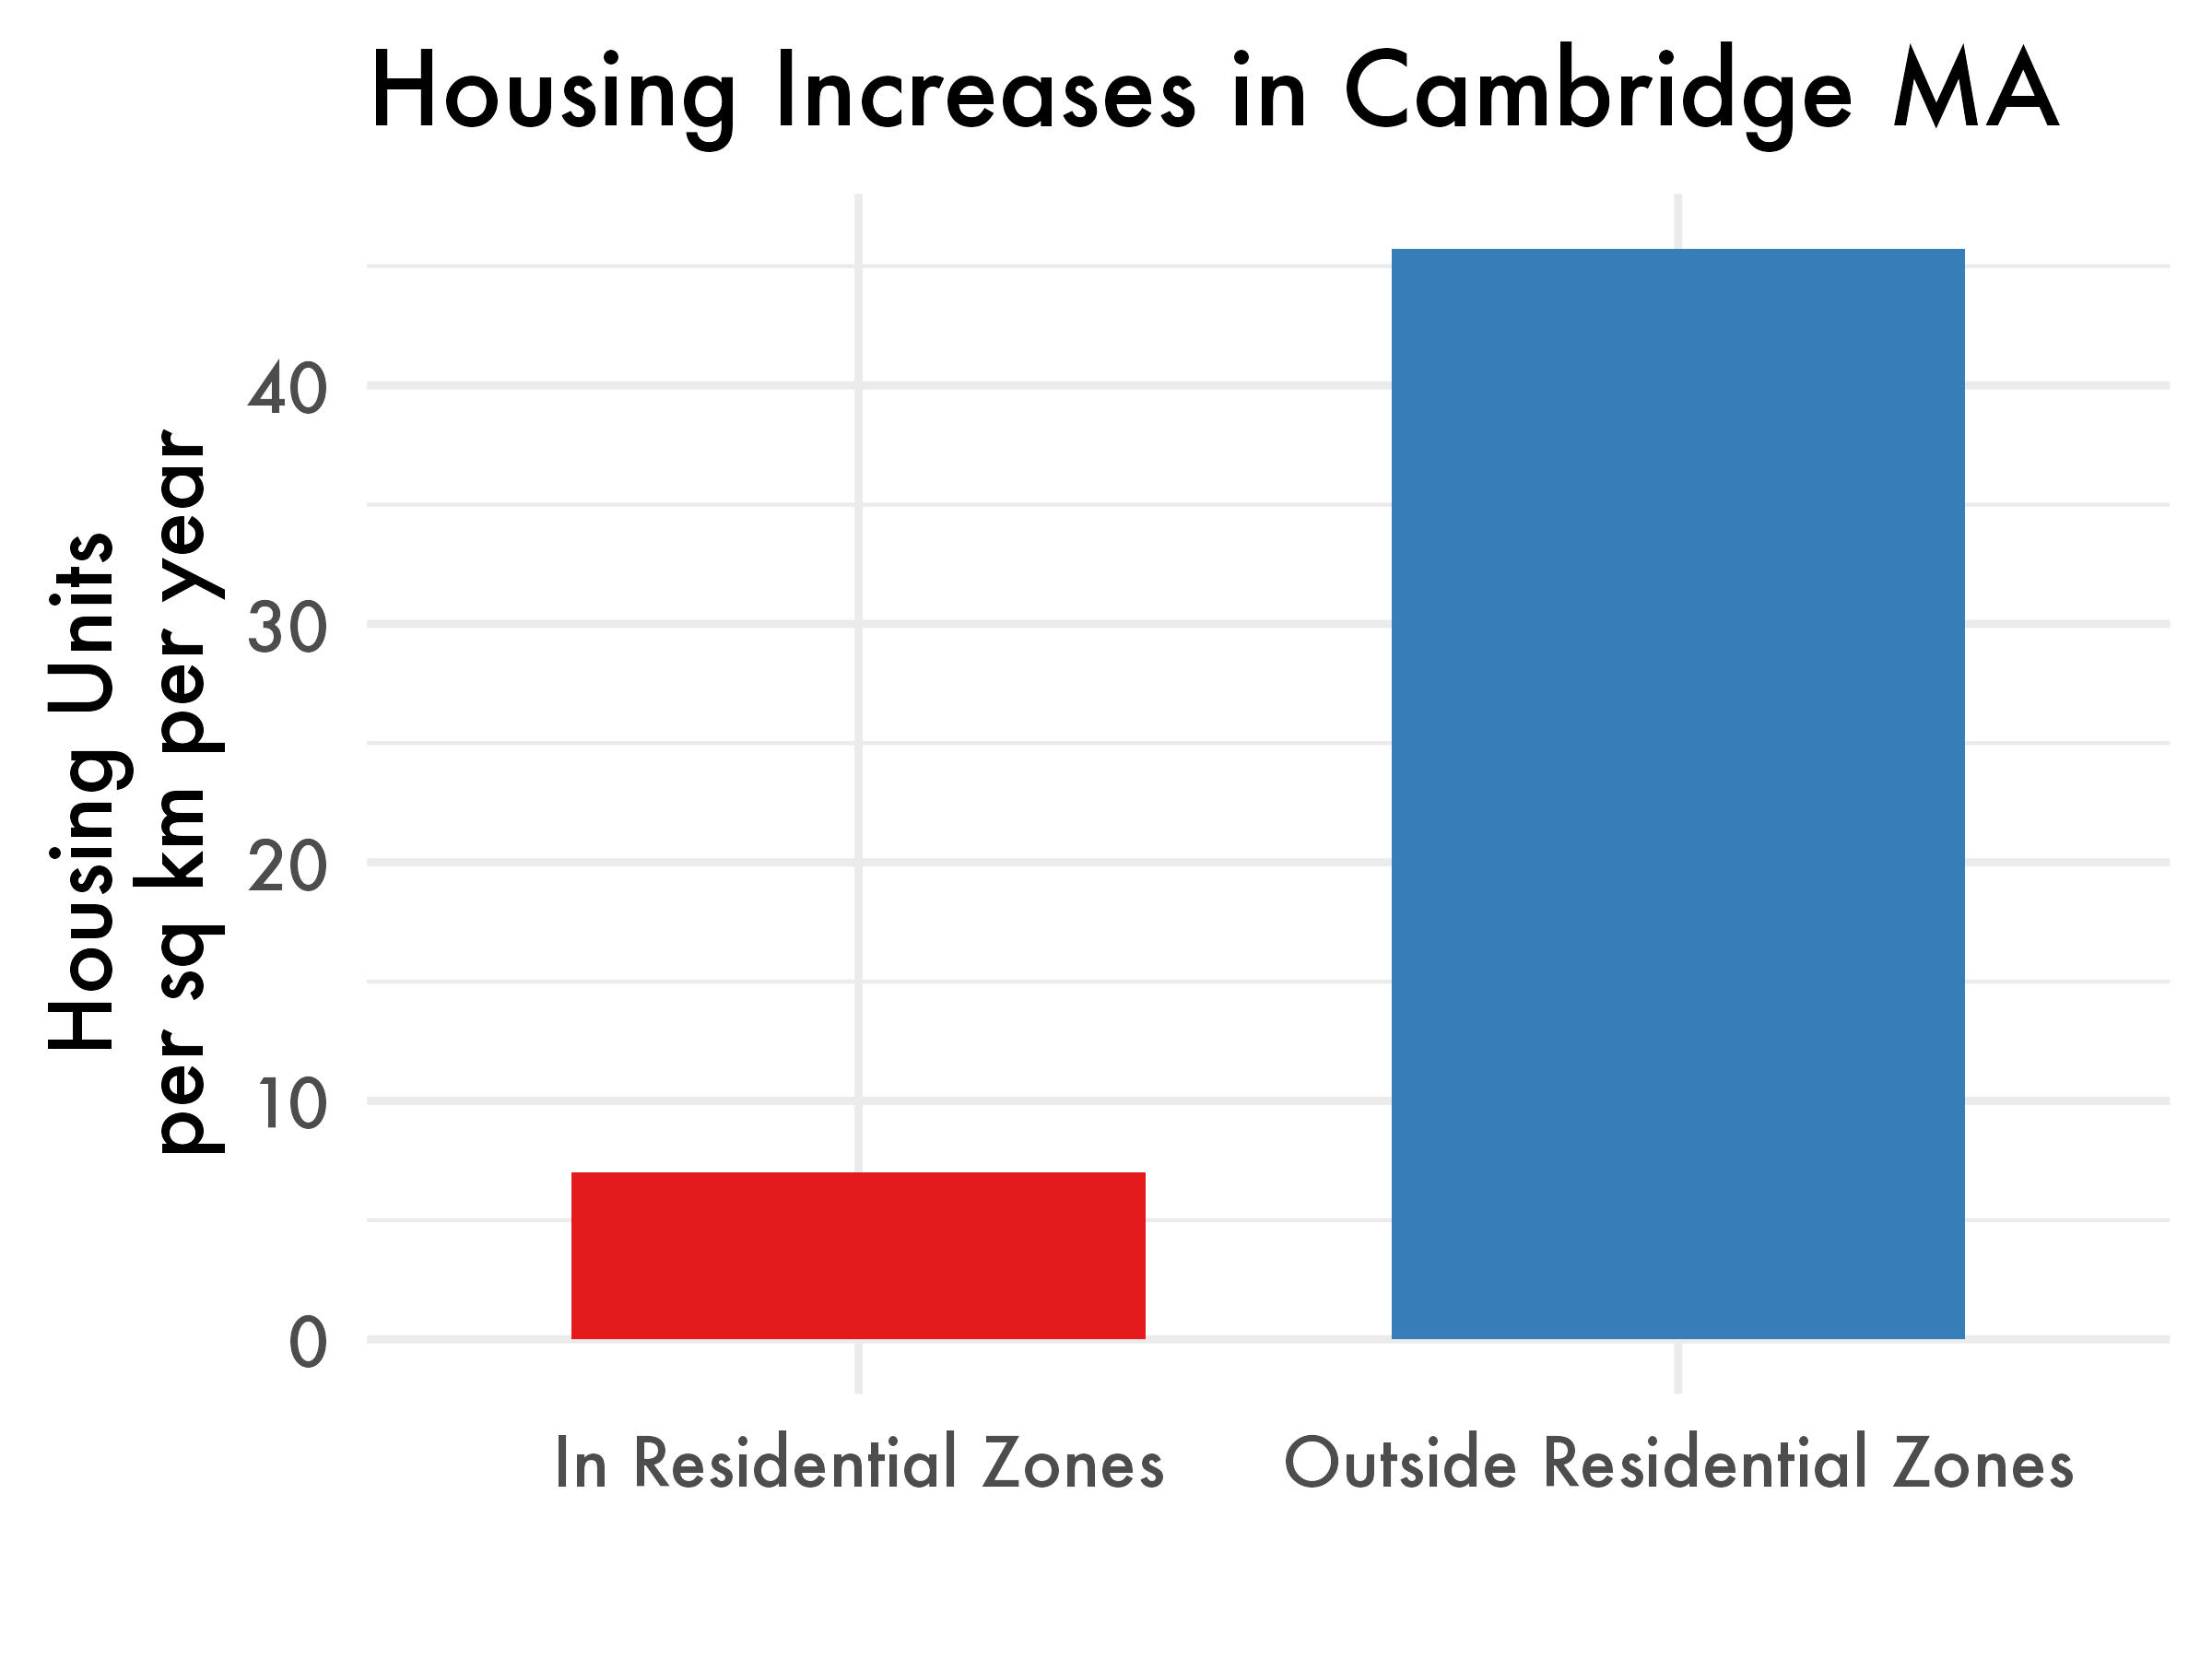
Cambridge is a small city immediately adjacent to Boston, Massachusetts with one of the worst housing crises in the country. Despite this, the city has done remarkably little to address the problem. Inside the city’s residential districts, the city constructed a cumulative 1,848 housing units over 29 years from 1996 to 2024, which amounts to 0.06 housing units per 100 residents per year. Notably, Cambridge has found a way to build most of its residences in non-residential districts. Of the total 14,216 net residences constructed since 1996, 12,368 were constructed in non-residential areas of the city. Annual housing production per sqkm is shown in Fig 1 below.
Cambridge’s residential areas, importantly, are not near capacity. These areas contain large numbers of detached 1-2 family housing units, some on estate sized lots that would not be out-of-place in the exurbs. The city has repeatedly found that there is adequate resources and infrastructure to build more housing in these areas. The question is not if there should be development but why there isn’t development in such a supply constrained market.
In 2025, the Cambridge city council passed one of the most sincere zoning reforms in the United States. With this accomplishment, the city government not only increased the allowable housing density across large regions of Cambridge, it also corrected the historical injustice of applying different housing rules to different neighborhoods with absolutely no underlying environmental or infrastructure based justification. This ordinance makes serious attempts at not just changing the base zoning, but also relieving arbitrary and punitive dimensional constraints which serve little purpose other than to restrict housing construction.
Neighborhood Conservation Districts (NCDs)
NCDs were established by the city council in 1983 in an effort to protect the character of wealthy neighborhoods in the city from further development. According to the Cambridge Historical Commission’s (CHC) website, these districts were founded to be “more effective” than zoning and more flexible than historic districts. Perhaps sensing that elected officials are suspicious, CHC goes to great length on their official website to cite the number of applications approved by the city. For example, CHC cites that 462 applications were approved in the Half Crown-Marsh NCD since 2013 for a 96.9% approval rate. Interesting that those 462 applications has resulted in -6 housing units within the NCD (Table 1, below).
| Neighborhood Conservation District | Total Net Housing Change (1996-2024) |
|---|---|
| None (Non-NCD Areas) | 1862 |
| Avon Hill | -5 |
| Half Crown-Marsh | -6 |
| Harvard Square | -6 |
| Mid Cambridge | 3 |
When considering the impact of NCDs, it is important to consider what they are not allowed to do:
- NCDs are not allowed to impose dimensional or setback restrictions greater than the base zoning
- Cannot consider size and shape (“massing”)
- Limited to considering incongruity within the district
In spite of this, NCDs have the power to issue binding decisions that can prevent permit issuance for a project with almost no oversight from the city council. Given that NCDs are forbidden from flouting the base zoning(s) of the district they reside within, if CHC’s claim is true that they issue approval 96.9% of applications then their should not be statistically meaningful differences in housing permits after controlling for neighborhood, base zoning(s), and area.
To determine if this is true, I examined the citywide dataset of housing starts and found statistically significant evidence that NCDs act as an independent suppressor on housing in Cambridge. The raw data says enough on its own: housing production in Avon Hill, Half Crown-Marsh, and Harvard Square has been negative over the past 29 years. In the same time span, the Mid Cambridge NCD has managed to add 3 housing units inside an area that is nearly a square kilometer (Table 1).
This is an important problem because the city recently upzoned all A and B regions of the city to C. If NCDs suppress housing, this will diminish the impact of the law.
Results
One of the more remarkable aspects of the housing starts dataset (outlined more in the Methods section below) is that Cambridge simply builds almost no housing, inside or outside of NCDs. This makes separating the effect of NCDs from base zoning a challenging task, particularly when considering NCDs that are a fraction of a square kilometer. The relevant statistical question, therefore, is pretty straightfoward: How many permits for how many units would be issued per sqkm per year in Res C, and does the observed data suggest a difference for areas inside NCDs?
Interestingly, when there is a housing positive development approved inside an NCD there is no statistical evidence that the number of units added is different from an equally zoned region outside the NCD (mean NCD fold change = 1.03 +/- 0.52).
NCDs Issue Fewer Housing Positive Permits Than Other Equal Area/Equal Zoned Regions
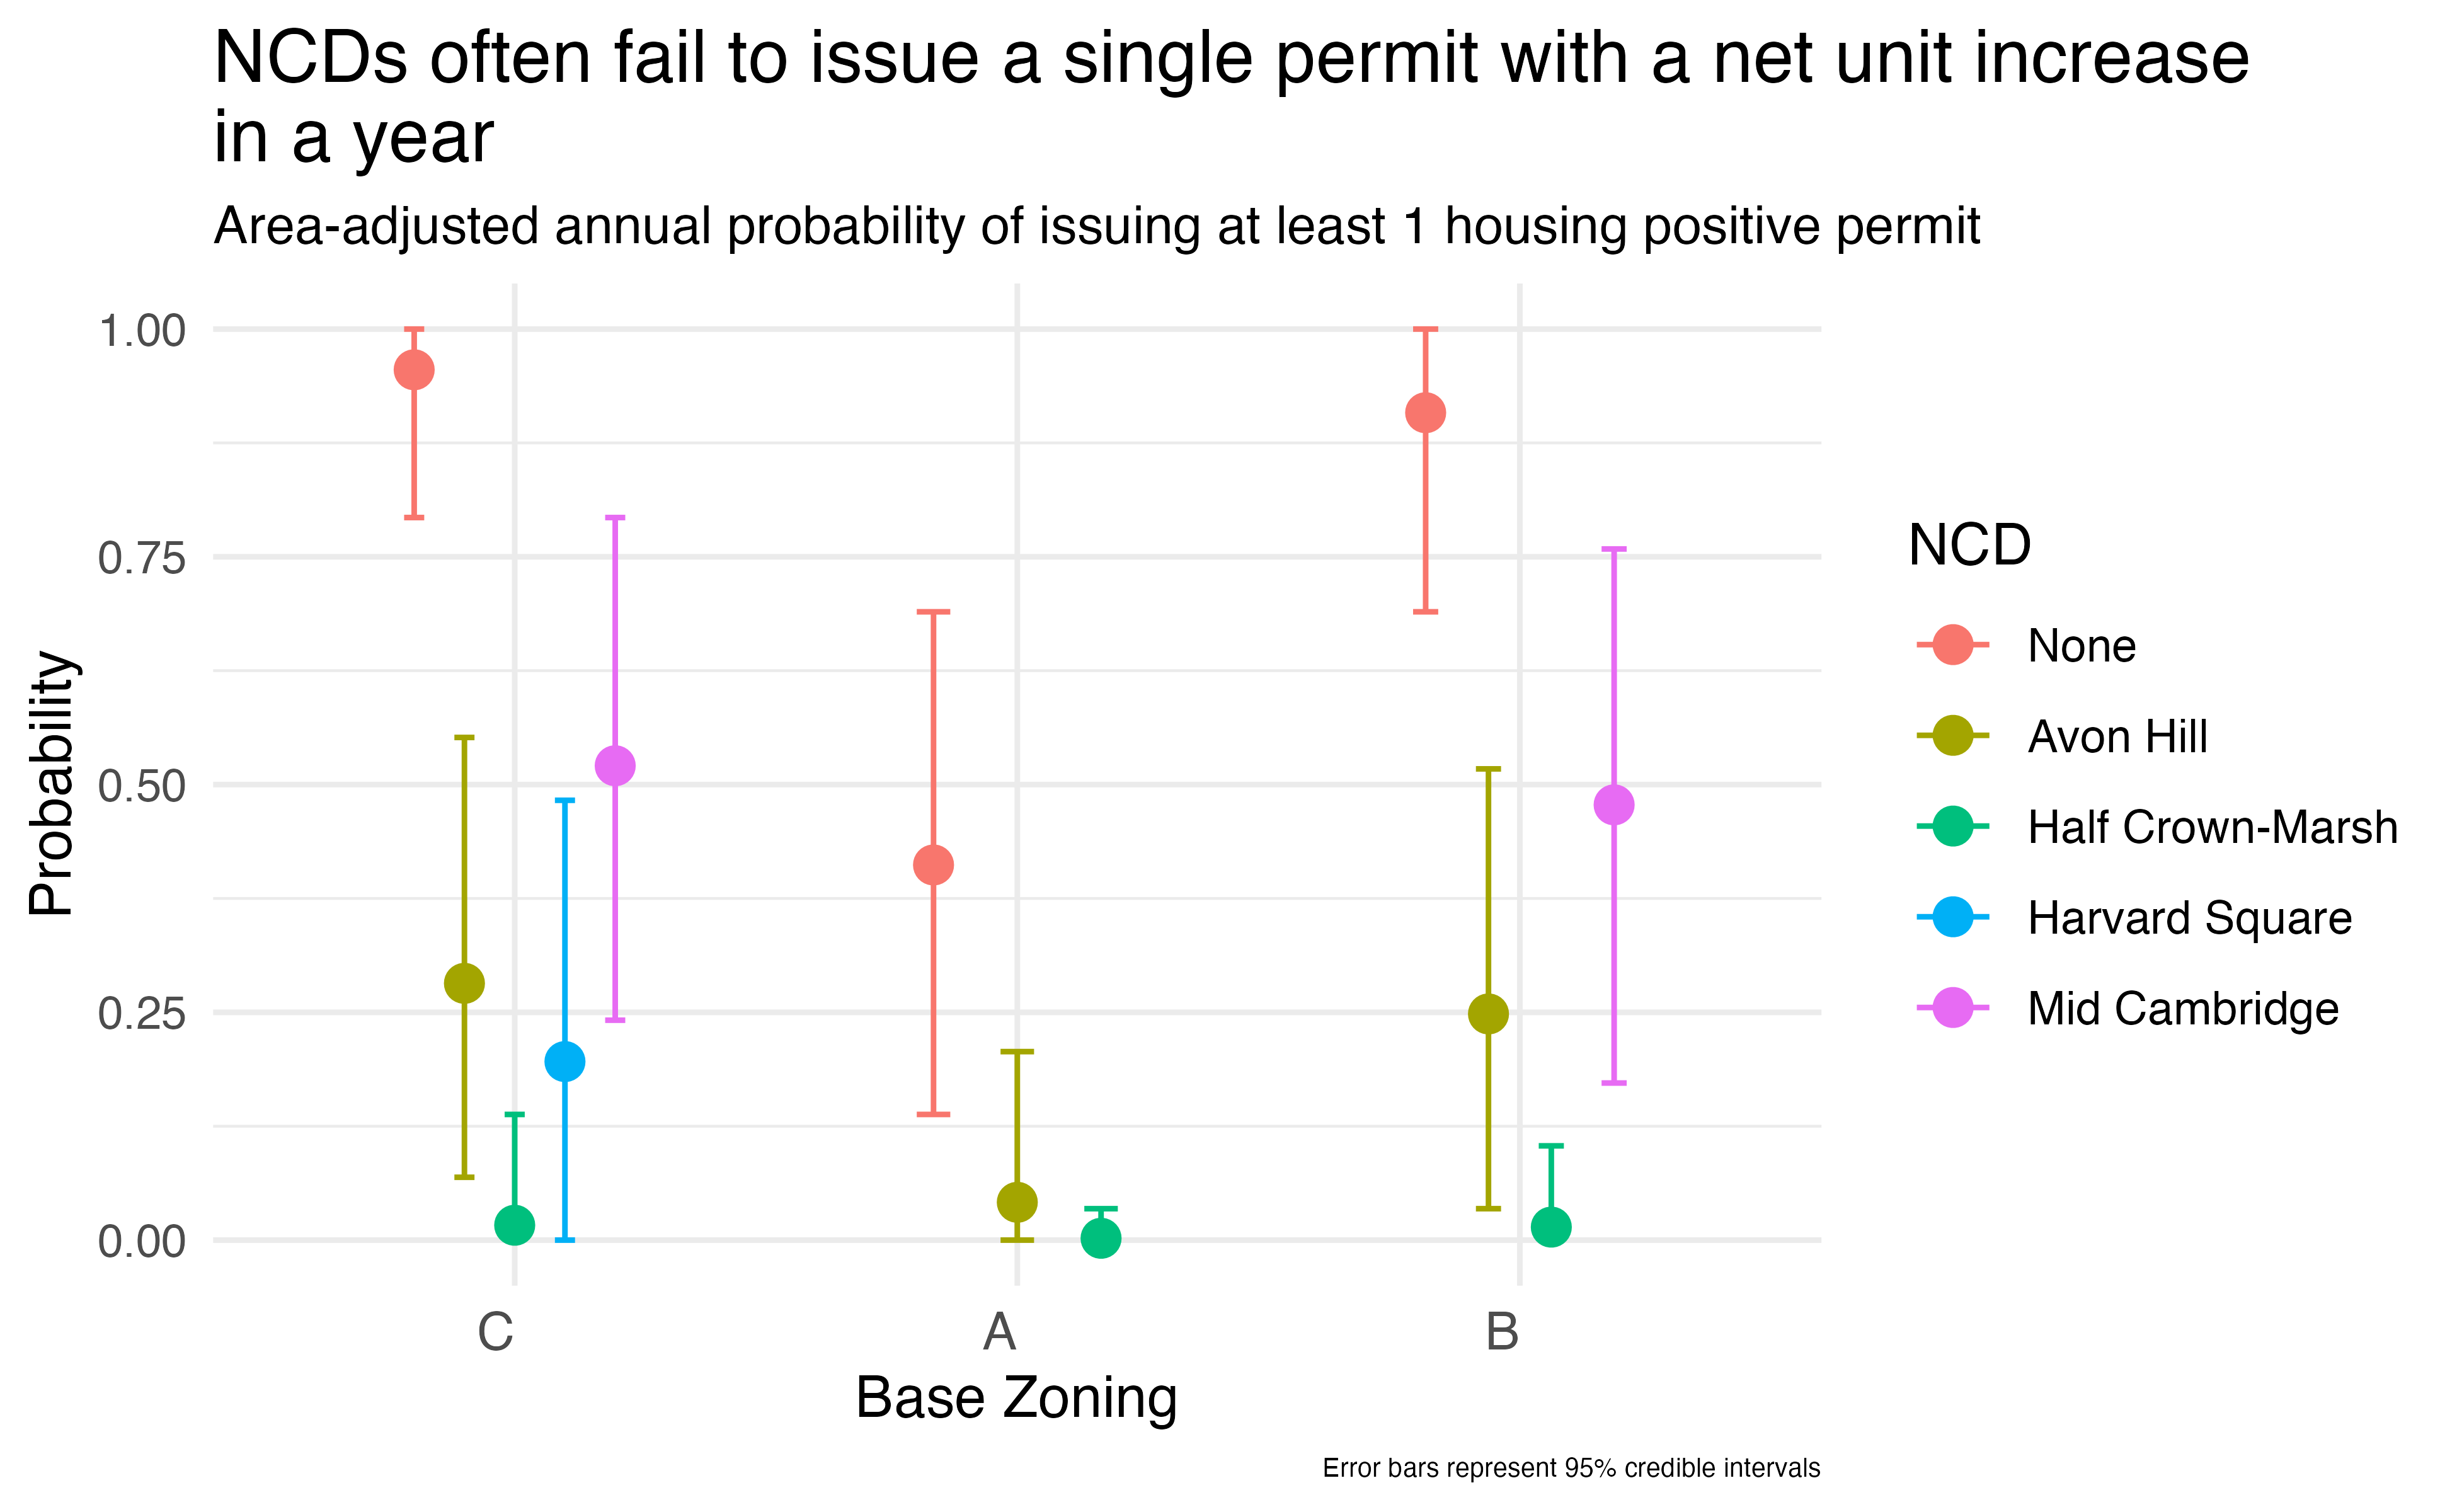
There is a large difference in the number of years for which their was at least 1 (yes just 1) net housing increase permit issued between NCDs and not-NCD areas. The results are striking: In nearly all cases, NCDs have substantially more years without any housing positive permits issued (Figure 3). Mid-Cambridge, the largest NCD with the most available data, gives the clearest picture of the effect that an NCD has when nested inside a predominantly Res C zoning district. The Mid-Cambridge NCD is ~50% less likely to issue a single permit that adds at least one net housing unit in a given year than an equivalent Res C plot of land outside the NCD. Half Crown-Marsh stands in a world of its own, issuing essentially nothing in the 29 year observation period.
NCDs Are Down-conversion Hotspots
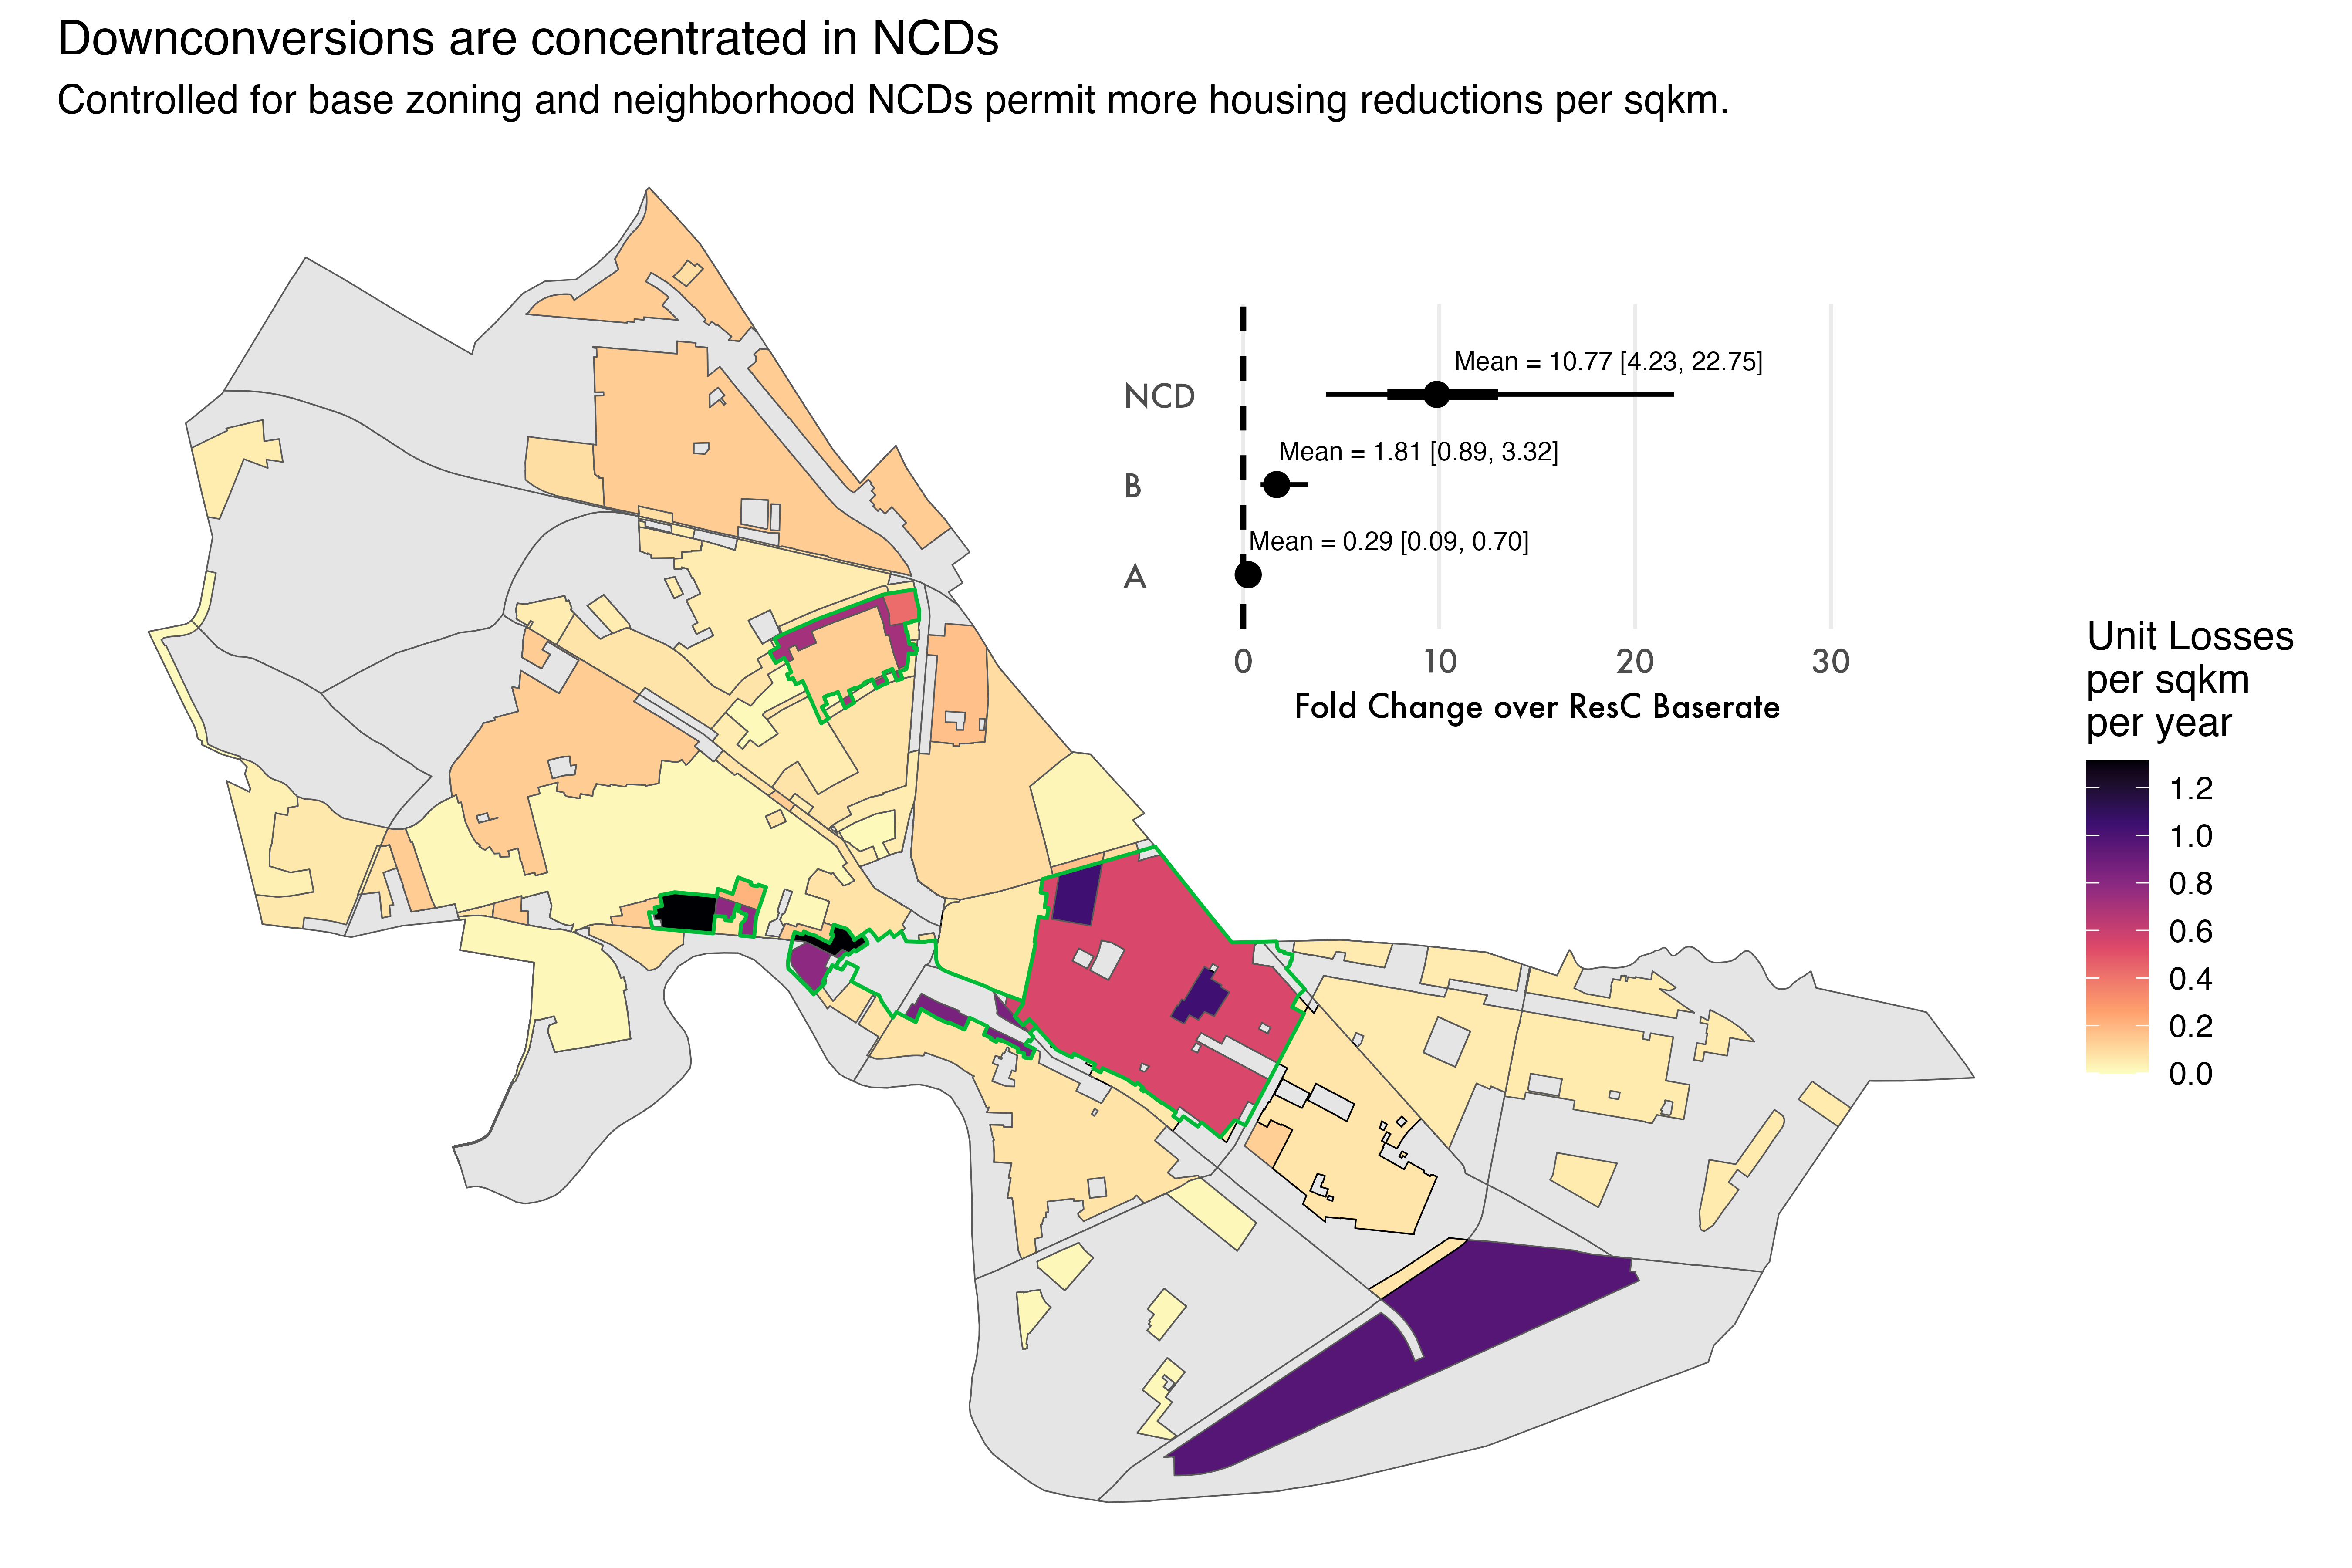
Perhaps more concerning than the rarity of housing unit increases is the concentration of down-conversions inside NCDs as compared to the remainder of the city. Indeed, after splitting the data into permits with net removals or net additions and examining the removals in isolation it is clear that NCDs have a strong and statistically significant effect that is associated with a large multiplicative increase (mean = 10.69x, 95% CI [4.50,21.57]) in the average number of unit losses per sqkm per year relative to the base rate of unit losses in an equally sized Res C parcel (Figure 4).
This is strong evidence that NCDs preferentially approve permits that are net housing losses. It is also reflective of the very real chilling effect that NCDs have on developers: why spend months battling against an unaccountable group and endless carrying costs when the lot can simply be converted into a single family residence?
Methods
R code and data are available at my github repo for this project.
Data Sources and Preparation
Data sources included GeoJSON files of NCD boundaries, residential districts, zoning districts, and neighborhood boundaries, alongside housing starts from 1996 to present, containing building permit and housing unit change data. Area calculations for each spatial unit were calculated in square kilometers. Zoning district areas were adjusted to account for NCD overlaps to ensure accurate density measurements.
Two specific cases inside the data were adjusted to correct for errors:
- 125 Harvard St
- The dataset incorrectly attributed the Geocode address to 345 Harvard St, which falls within the Mid Cambridge NCD.
- The correct lat and lon were added for this entry.
- 273 Harvard St
- This development converted a nursing home into a assissted living for senior facility. Records do not exist for the number of beds present at this location prior to its reconstruction.
- The development was removed from the dataset.
Spatial Analysis
Spatial joins connected housing data with corresponding geographic areas. Each development was assigned attributes indicating NCD status, specific NCD name (if applicable), residential district, zoning type (A, B, or C), and neighborhood name.
Housing data was filtered to exclude entries with missing coordinates or undefined net unit changes. Data was aggregated by year and geography, with zero values included for years without recorded housing activity for each unique combination of NCD, Neighborhood, Assessing District, and Zoning Area.
Metrics
Many projects have negative net unit swings, which cannot be directly modeled by count distributions most appropriate for this data. For this reason, the data were split into three categories:
- Housing additions (positive net change)
- Housing removals (absolute value of negative net change)
- Housing starts (permits with positive net change per year)
All metrics were normalized by geographic area for valid cross-district comparisons.
Statistical Modeling
Bayesian generalized linear models (GLMs) were used to fit the relationship between NCDs and housing development while controlling for other factors. Due to the preponderance of zero observations and high variance of unit changes, zero-inflated negative binomial likelihoods were used for the housing additions and removals. For the permit starts data, a beta-binomial likelihood was used to account for the relatively large amount of uncertainty present in the data. Together, these models were chosen to best estimate uncertainty and minimize unsupported conclusions from the data.
- Housing Additions Model: Zero-inflated negative binomial model:
model_additions <- brm( housing_added ~ Zoning + IsNCD + (1 | Year.Permitted) + (1 | Neighborhood_name) + offset(log(area)), data = modeling_data, family = zero_inflated_negbinomial(), chains = 8, iter = 1000, cores = 8) - Housing Removals Model: Zero-inflated negative binomial model:
model_removals <- brm( housing_removed ~ IsNCD + Zoning + (1 | Year.Permitted) + (1 | Neighborhood_name) + offset(log(area)), data = modeling_data, family = zero_inflated_negbinomial(), chains = 8, iter = 2000, cores = 8 ) - Permit Probability Model: Beta-binomial model:
  permit_model <- brm(
  bf(successes | trials(successes + failures) ~  Zoning + NCD + offset(log(area))),
  data = corrected_permit_data,
  family = beta_binomial(),
prior = c(
  prior(normal(0, 1), class = "b"),
  prior(gamma(2, 1), class = "phi")  # Prior for overdispersion
),
  chains = 8,
  cores = 8,
  iter = 2000)
Models incorporated area offsets and random effects for year and neighborhood to account for size differences, temporal trends, and geographic variations.
Implementation and Analysis
Models were implemented using the brms package with 8 MCMC chains and 1,000-2,000 iterations. Weakly informative priors were specified for the permit probability model to improve stability.
Analyses derived from posterior distributions included effects of NCDs on housing additions/removals, permit issuance probability estimates across zoning types and NCD status, and 95% credible intervals for all parameters.